Publish interactive maps from your GIS data
Import geodata, style it, and share or embed a polished map view. No viewer licenses, no credit systems, no engineering team required.
What you can build
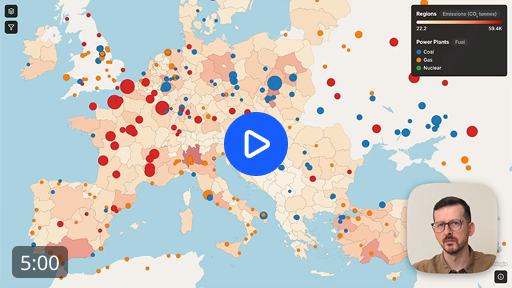
Whether you are working with dense point datasets, regional polygons, time-stamped records, or data that needs aggregation, Topologis gives you the right map view to publish and share.
A million points, still readable
Turn dense point data into a heatmap so viewers can see the overall pattern instead of a wall of markers. This example uses over one million pickup locations and renders them as areas of higher and lower activity.
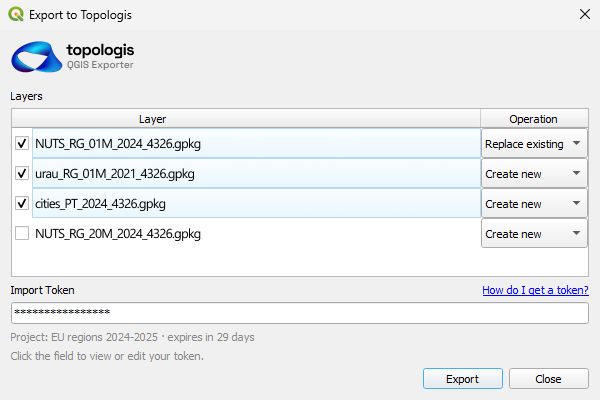
Fits in your workflow
Bring in the data you already have, or connect a source that keeps itself up to date. Topologis turns it into a map you can share.

Connect a live source
Import your data from the cloud and auto-refresh on a schedule.
 Google Sheets
 File URL
 API
APIDrop a file
Upload common formats that you already work with.
 .json
.json .csv
.csv .shp
.shp .gpkg
.gpkg .kml
.kmlComing soon
 S3
S3 PostGIS
 Redshift
 BigQuery
Pay for editors, viewers are free
- Unlimited viewers, no account needed
- 14-day free trial
- 10GB storage per seat